

Will the Precious Metals be the Greatest Bull Market of our lifetime?
Summary
- US equities today trade at truly record valuations, a full-blown mania. Some asset bubbles are already bursting.
- The precious metals mining industry is the one clear industry to directly benefit from this monetary and fiscal indulgence.
- The lack of investment in exploration and new gold and silver discoveries is setting up an incredibly bullish scenario for metals.
*
Central banks are facing a serious predicament. After decades of ongoing accommodative monetary policy, the world is now sitting at record levels of debt relative to global GDP. There has never been a bigger gulf between underlying economic fundamentals and security prices. We are in a global recession, but equity and credit markets still trading at outrageous valuations. Markets are trading on a perverse combination of Fed life support and rabid speculative mania. Meanwhile, demand for gold and silver, which is fundamentally cheap, is starting to take off as central banks are engaged in new record easy monetary policies. Ongoing easy monetary policies in the face of today’s asset bubbles in stocks and fixed income securities have a high probability of leading to a self-reinforcing cycle that drives investors out of these over-valued asset classes and into under-valued precious metals. To check where we are headed you can see this article as well: ARE WE HEADED TOWARD APOCALYPSE?
*
Here are just some of the reasons to buy undervalued gold and silver today:
- The economy is now reaching credit exhaustion with record amounts of government and corporate debt relative to GDP worldwide.
- The debt burden ensures weak future real economic growth.
- Monetary debasement is the only way to reduce the debt burden. Fiat currencies are now engaged in a race to the bottom.
- Global monetary base expansion to suppress interest rates creates a supercharged environment for gold and silver.
- The global economy is in a severe recession with structural underpinnings beyond Covid-19.
- Unemployment has spiked a historic 6.7% in just five months from 3.5% to 10.2% even after settling back from temporary 14.7% Covid-19 lockdown levels.
- US equities today trade at truly record valuations, a full-blown mania. Ongoing policy rescue has perverted both free-market accountability and price discovery creating a simultaneous zombie economy and stock market bubble which is unsustainable. Speculative asset bubbles are ripe for bursting.
- During the 1970s precious metals bull market, 10-year real yields got as low as -4.9%. We strongly believe we are headed in that direction and again with a long runway, especially with Jay Powell’s latest signaling from Jackson Hole.
- A colossal $8.5 trillion of US Treasuries will mature by the end of 2021 and will need to be refinanced. In the US the Fed is the only entity capable of swallowing its debt guaranteeing new record levels of money printing to top today’s already historic levels.
- Precious metals became a forgotten class among large allocators of capital in the extended expansion phase of the last business cycle.
- With $15 trillion of negative-yielding bonds, equities’ earnings real yields at a decade low, and corporate bonds near-record prices, gold, and silver are being rediscovered for their tactical as well as strategic risk-reducing and return generating properties in prudently balanced portfolios.
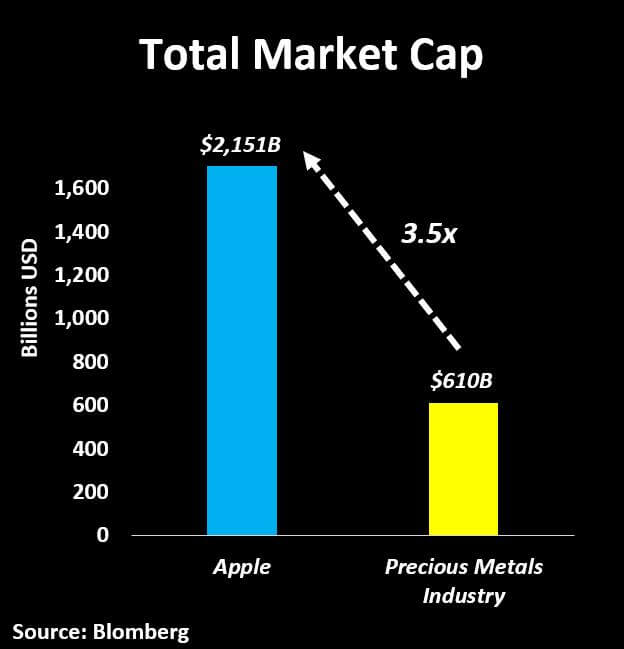
- The precious metals mining industry is the one clear industry to directly benefit from this monetary and fiscal indulgence. The aggregate market value of this industry still is almost 3 times smaller than Apple’s market cap.
- Precious metals are now trading at historically depressed levels relative to money supply; overall stocks, on the other hand, are the complete opposite.
- After a decade-long bear market, precious metals miners have been reluctant to spend capital. Now, they have historically low equity dilution, clean balance sheets, and record-free cash flow growth.
- The lack of investment in exploration and new gold and silver discoveries is setting up an incredibly bullish scenario for metals as supply is likely to remain constrained for an extended period at the same time while demand is poised to explode.
- The year-over-year change in gold prices just broke out from a decade-long resistance. Last time we saw such strong appreciation was at the early stages of the 1970s Gold Bull Market.
- Financial markets simply cannot withstand higher interest rates. The Fed and the central banks all over the world have been forced into a new mandate, to suppress yields at all costs. This dynamic of expanding the monetary base to purchase assets and manipulate rates lower is an explosive mix for precious metals.
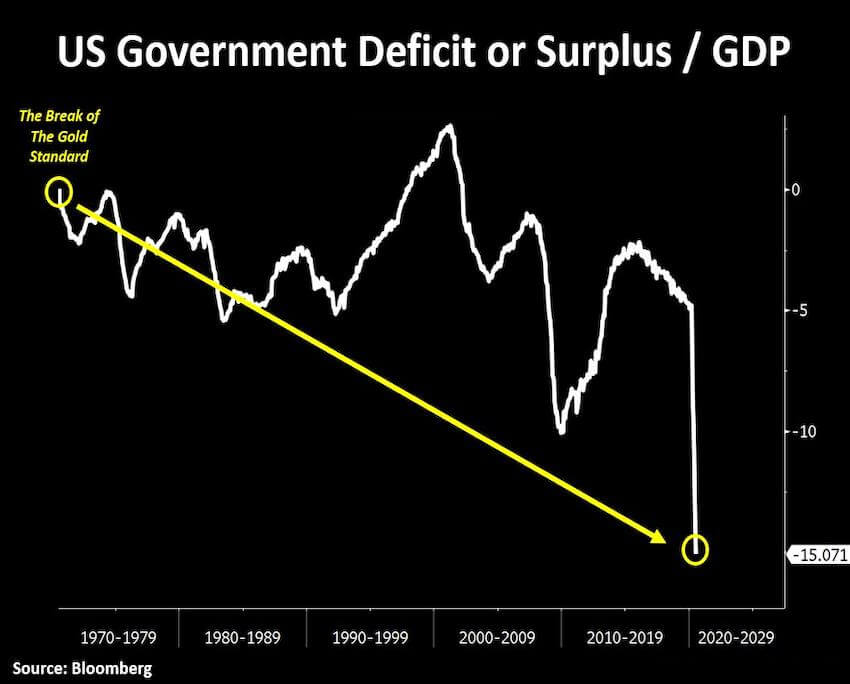
- The break of the gold standard in 1971 is just as impactful as the Fed’s recent unlimited QE policy. Back then, it marked a period of lack of financial and fiscal discipline that triggered a frenetic 10-year Bull Market for Gold. This time, we have arguably even stronger macro drivers for precious metals. As we show in the chart below, we have been in a clear trend of structurally increasing government deficits:
*
*
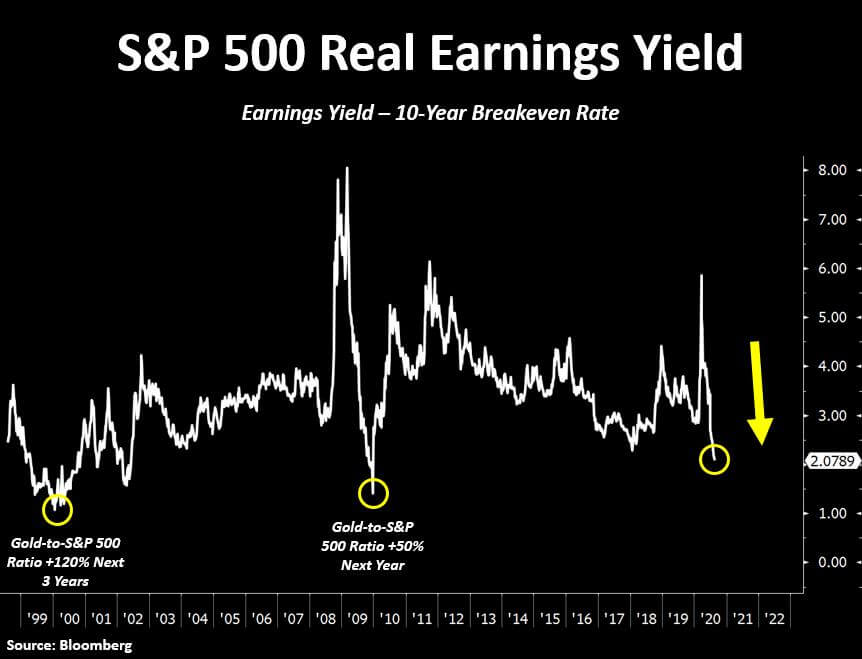
The S&P 500 real earnings yield is at its lowest level in a decade. Prior lows were also times that gold outperformed equities. In the early 2000s, for instance, the gold-to-S&P 500 ratio went up by 120% over 3 years. Even in 2010, a bull market for stocks, gold outperformed by 50%. The difference this time is that stocks have never been so overvalued at the same time as the economic growth outlook has been so challenged. This is the perfect time to buy precious metals and sell stocks.
*
*
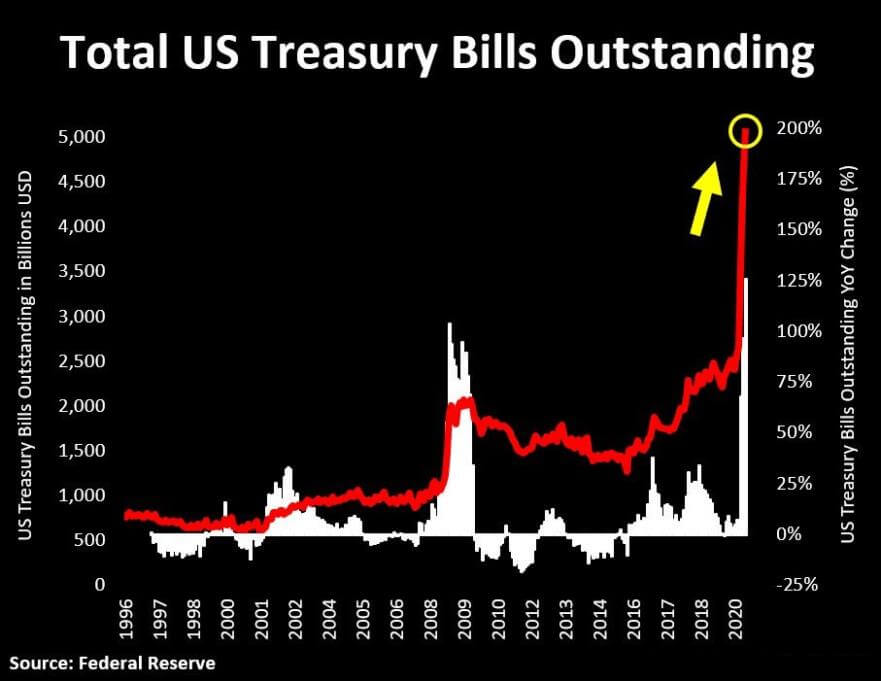
The debt quandary the US government faces also adds tremendously. From a funding perspective, 71% of all Treasuries issued in the past year mature in less than 12 months, resulting in Treasury Bills outstanding to surge to $5 trillion! The US Treasury is hoarding a record of $1.79 trillion of this cash. A similar build-up happened back in 2008-9. A major difference this time is the fact that Treasury Bills outstanding are almost $3.3 trillion higher than their cash balance. In such a scenario, the average maturity of government debt has dramatically declined to 64 months. As a result, there is a tsunami of $8.5 trillion of Treasuries that will be maturing by the end of 2021 ensuring astronomic levels of money printing in the near term.
*
*
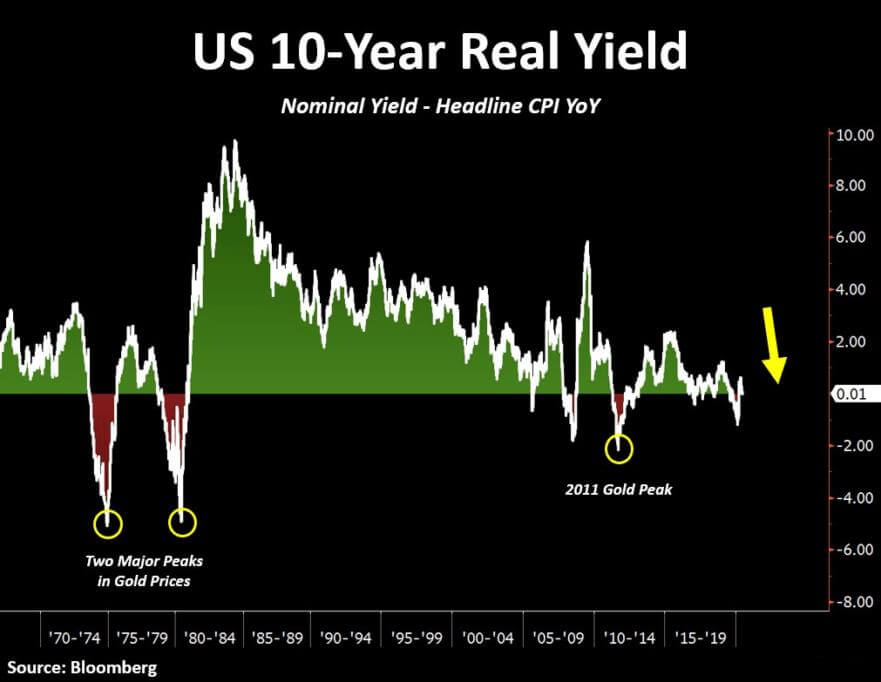
Skeptics of the long gold thesis often say real yields can’t move any lower. This is often because they are looking at the TIPS market which only dates back to 1997 and real yields are already at their lows for this time frame. Therefore, some investors assume interest rates when adjusted for inflation expectations have never been lower. That, unfortunately, fails to include one of the most important analogs to today’s set up, the decade of the 1970s. Back then, 10-year yields less inflation measured by CPI twice reach as low as about -4.9%. Those moments of large and declining negative real interest rates drove two of the US most significant surges in gold, silver, and precious metals mining stocks in US history. In today’s conundrum, corporations and governments are historically indebted and can’t take higher nominal yields, ensuring that strong monetary stimulus is here to stay to drive real yields lower, just like Jay Powell has promised.
*
*
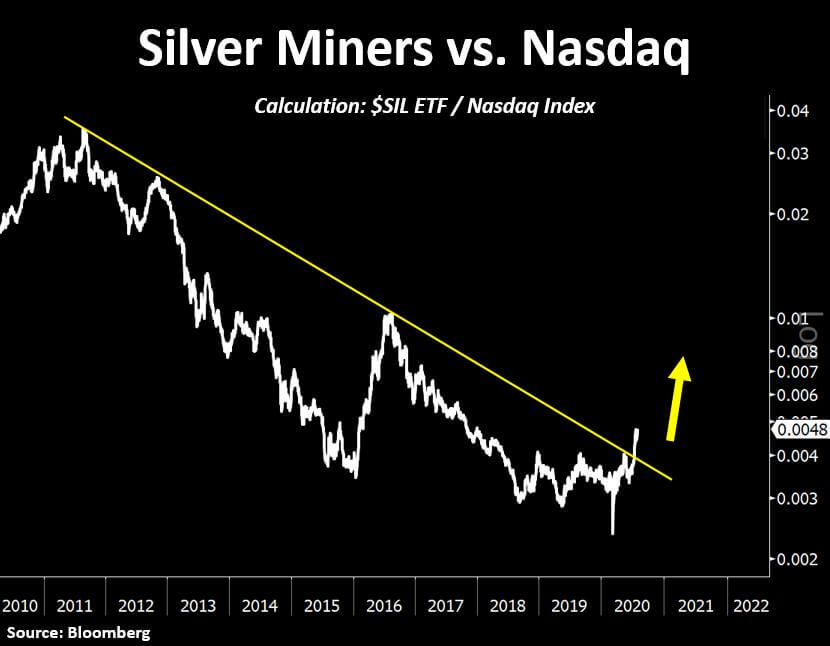
A major narrative shift is underway. The old times of precious metals being perceived just as haven assets are probably over. With $15 trillion worth of negative-yielding bonds, record overvalued stocks and a historically leveraged global economy, investors will likely begin to look at gold and silver with a fresh pair of eyes: growth and value. Precious metals miners are the only industry where we are seeing strong and sustainable growth in revenues and future free cash flow at still incredibly low valuations today. Investors are starting to take note. Silver mining stocks, for instance, have already started to outperform even the market darlings, tech stocks. This is only the beginning of a new era for precious metals.
*
*
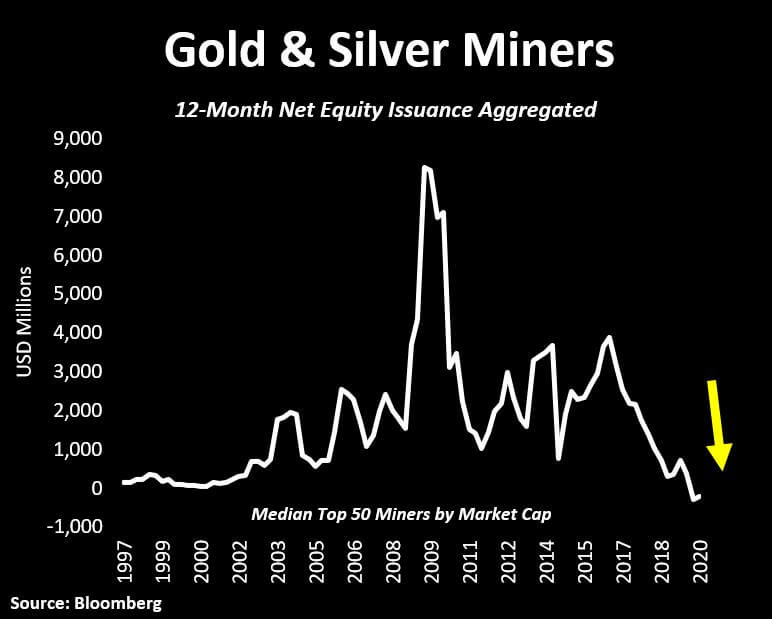
The mining industry built a reputation of being capital destroyers since it peaked in 2011. But today this skepticism is no longer warranted. It is mind-blowing that gold prices have just hit record highs and the larger mining companies have barely engaged in share dilution. In aggregate, the top fifty gold and silver miners by market cap that trade in Canadian and US exchanges have only issued close to $266 million in equity in the last twelve months. That was the second-lowest amount of 12-month equity issuance in the last 3 decades. These companies have also just paid down $200 million of debt in the last quarter.
*
*
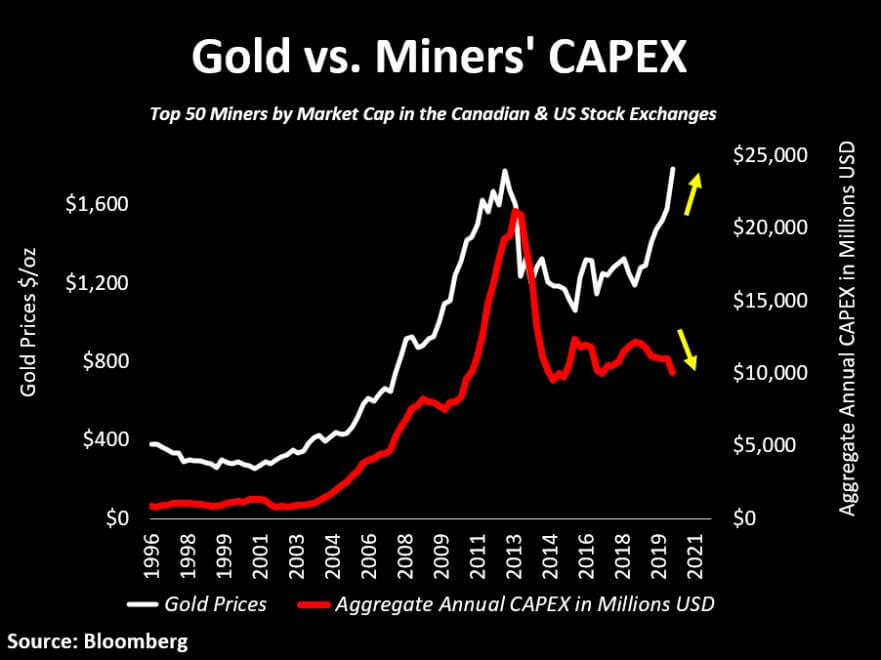
The spending by miners is extremely conservative. Throughout history, the CAPEX cycle for the industry tends to follow gold and silver prices incredibly close. Logically, this makes sense. As metal prices move higher, these businesses become more optimistic and therefore focus on advancing their projects. This time, however, even though gold and silver prices have moved significantly higher, companies remain reluctant to spend capital. This level of divergence never happened in prior bull markets for precious metals. This is fundamentally bullish for the entire asset class as we expect the supply of gold and silver to stay constrained for longer. It is also fundamentally bullish in the industry where capital can be deployed into undervalued companies with big, highly economic projects that are ripe to move forward in the current macro environment.
*
*
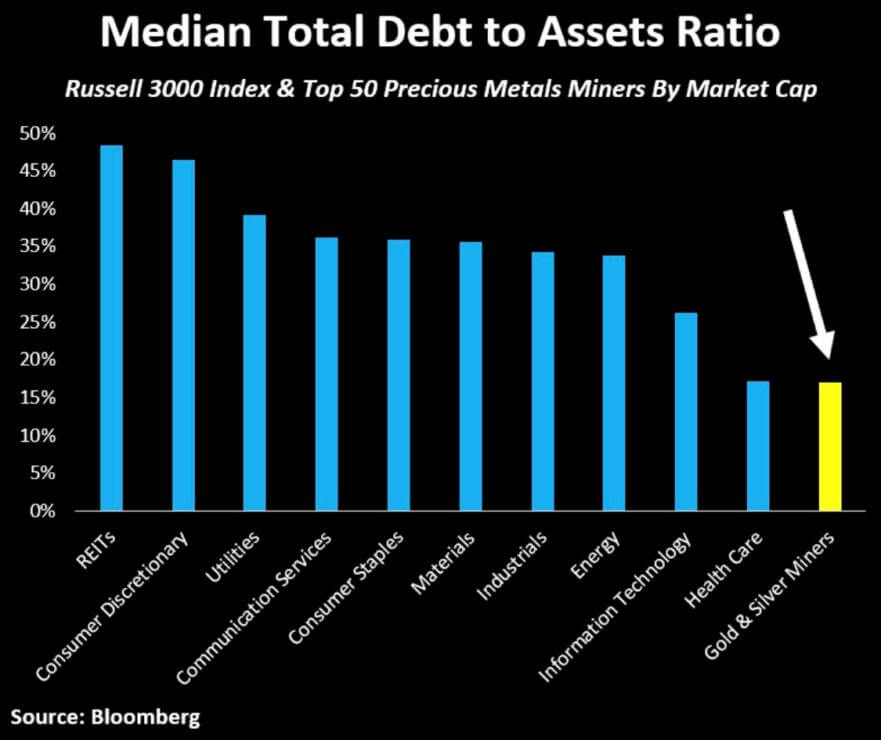
Precious metals miners have never looked so financially strong. If the industry were a sector, it would have the cleanest balance sheet among all sectors in the S&P 500. The median company in the S&P 500 today has historically high total debt to assets of 35%. Top miners, on the other hand, have only 12%. For such capital-intensive businesses, today’s healthy industry-wide capital structure is a nice set-up to kick off a new secular bull market in precious metals mining.
*
*
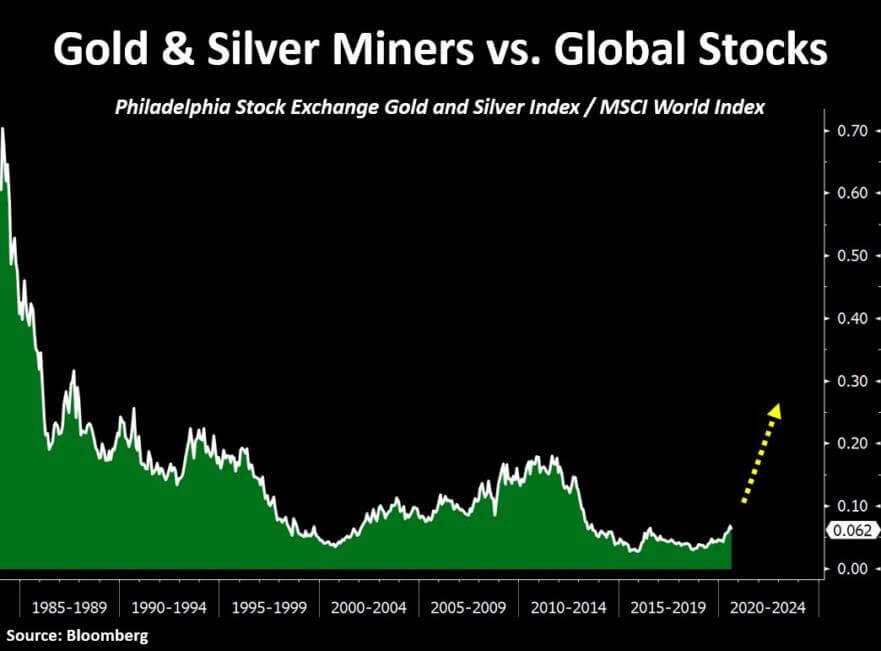
It is important to get a sense of both the value and growth opportunity today to see the incredible appreciation potential ahead of us. When we look at the ratio of gold and silver miners to global equities, it is still near all-time lows and appears to form a very bullish base, similar to what we saw back in the early 2000s. Mining stocks meanwhile are about to become free cash flow growth machines. It is far and away from the industry with the strongest combination of deep value and high growth opportunities for today’s macro-environment.
*
*
In contrast to the value and growth prospects for miners, it is shocking to see Apple’s (AAPL) market cap still about 3.5 times the size of the entire precious metals industry. If anything, this reflects the level of skewness to the upside for gold and silver stocks in the near and medium-term. This is the only industry to truly benefit from today’s world of unlimited QE and deficits.
*
*
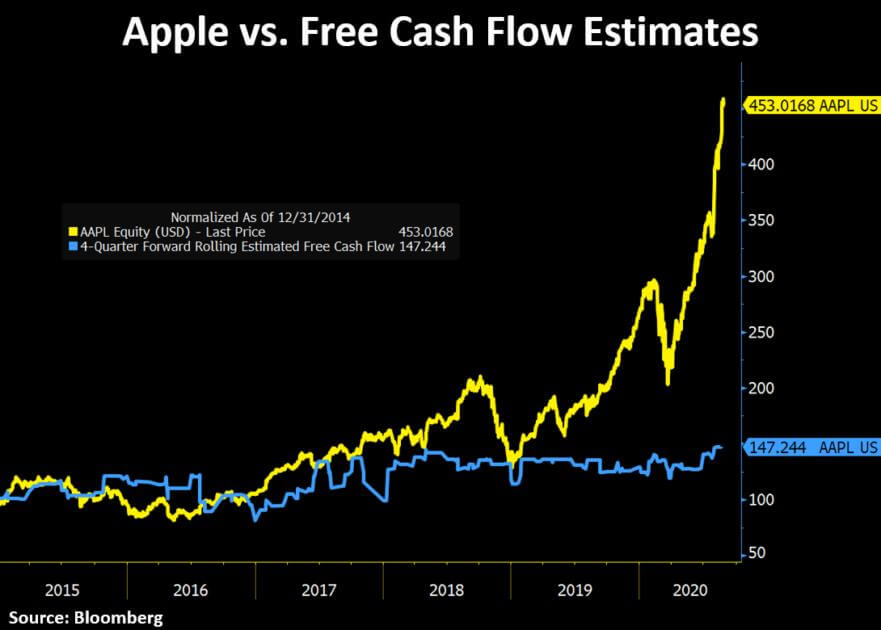
As we show below, Apple’s stock price appreciated at a much faster growth rate than its underlying free cash flow on a rolling twelve-month, forward-looking basis. The stock price is way ahead of its fundamentals. Apple is just one of the many poster children for manic speculation and excess in today's stock market at large. Stocks like Microsoft (MSFT), Tesla (TSLA), and Netflix (NFLX) show similar-looking disconnects.
*
*
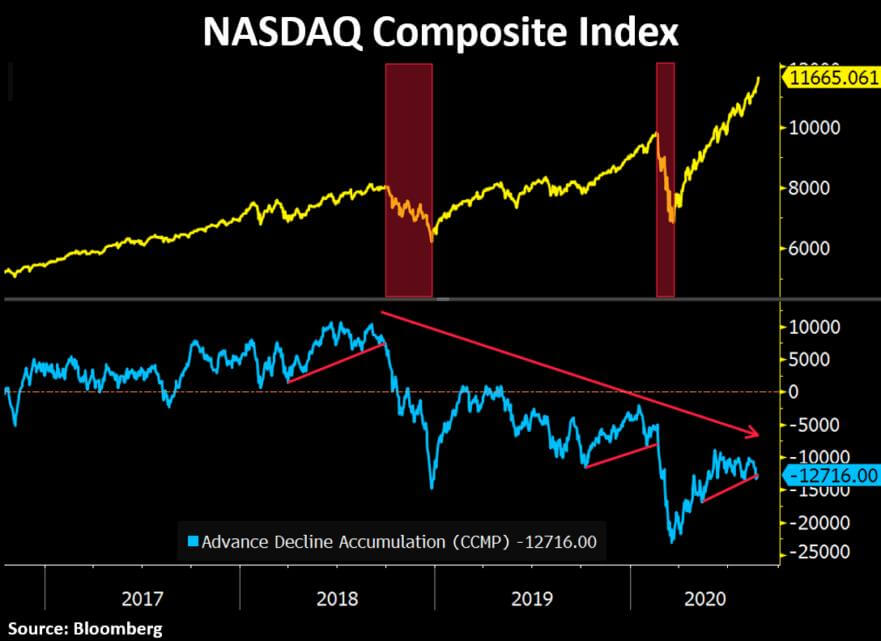
With stock market indexes making new highs, the narrowing breadth is ominous, especially in the tech-laden NASDAQ Composite.
*
*
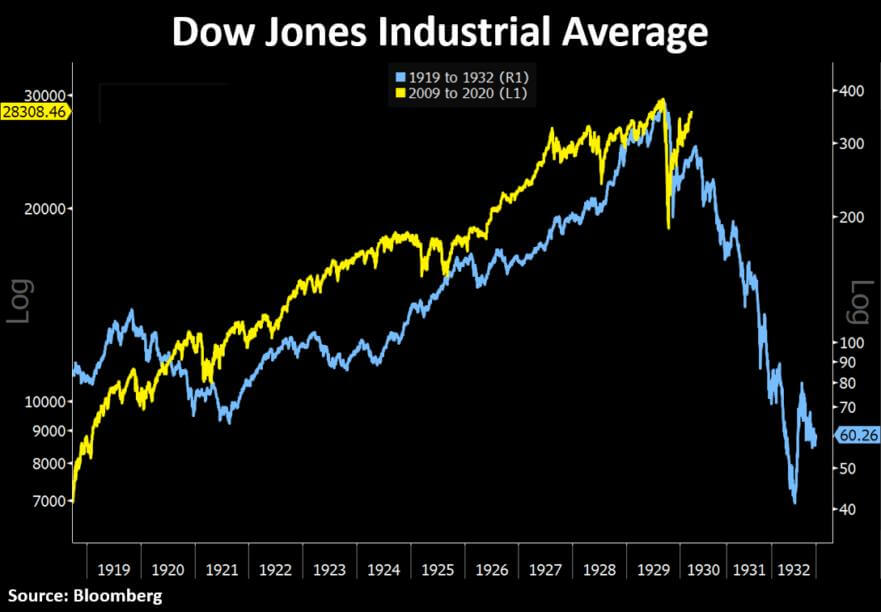
The stock market is more over-valued than it was in 1929 and higher than in 2000.
*
*
To think that the stock market does not have any downside risk because the Fed has its back is absurd. False hope in the Fed’s ability to sustain these market valuations is perhaps the sole remaining illusion holding this market up. If you are in the crowded investor camp that believes easy monetary policy can prevent a market crash this time around because the Fed is engaged in easy monetary policy unlike the Great Depression, do yourself a favor and look up what happened to stock prices and multiples during the 1973-1974 bear market.
*
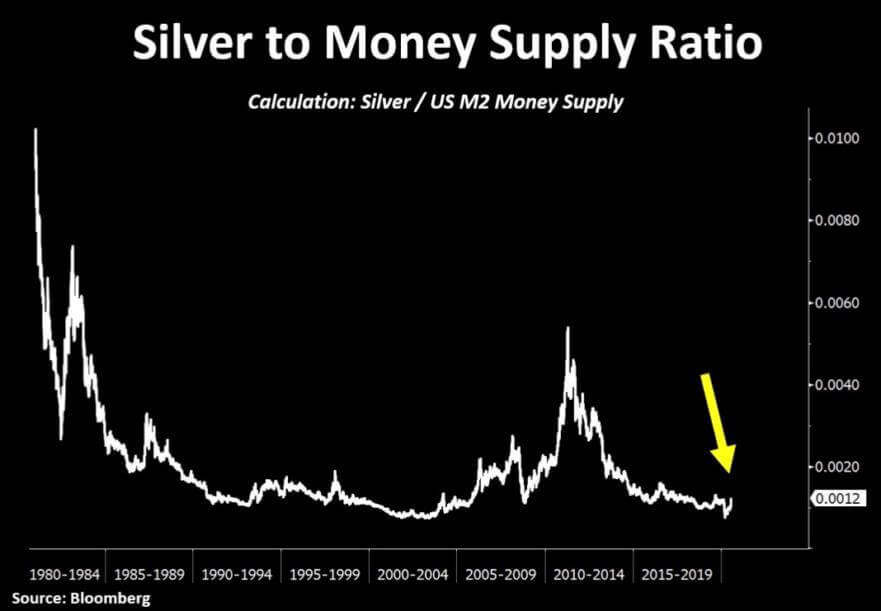
Easy monetary policies are much more likely to drive investors out of overvalued stocks and into under-valued precious metals. One precious metal that we are most excited about today is silver. Throughout history, silver has played an important role in the monetary system. Its recent price surge made a lot of investors question the sustainability of this move, but in the grand scheme of things, silver remains near all-time lows relative to the size of the US M2 money supply. The chart below is analytically important as it zooms out the still-early stages of what could be an incredible upsurge.
*
*
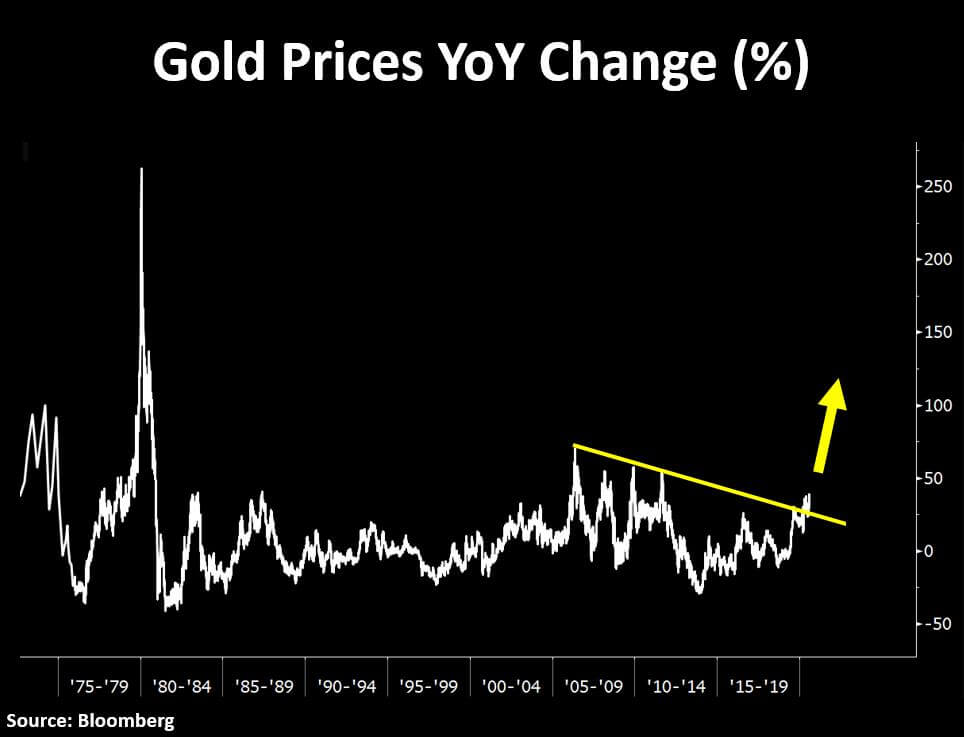
The gold prices on a year over year basis just broke out from an over decade-long resistance. This is an important validation of our precious metals’ thesis. In our view, this looks a lot like the beginning of a late 70’s bull market.
*
*
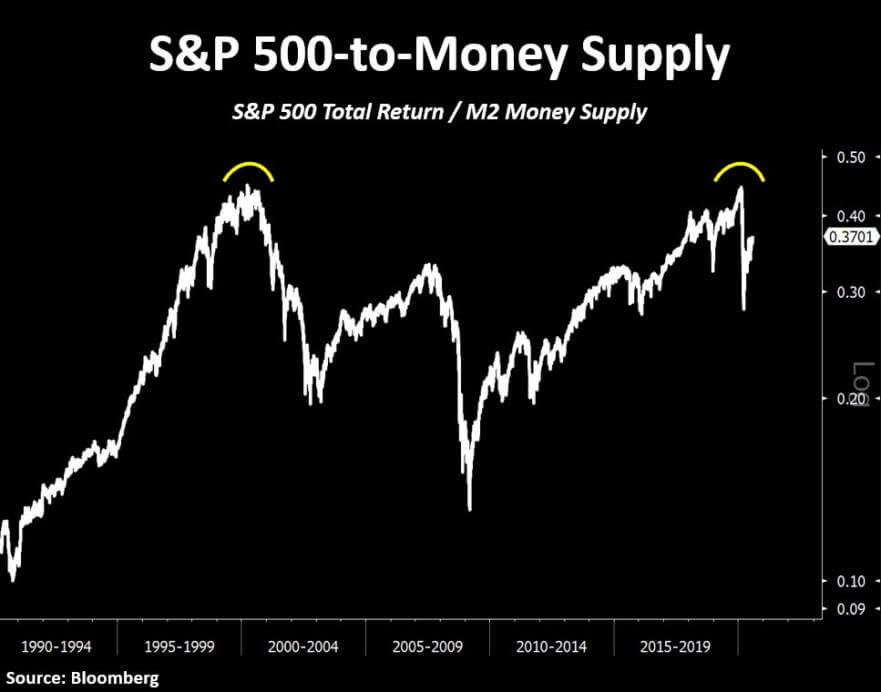
Even after the largest liquidity infusion seen in history, equity markets are not only overvalued relative to their fundamentals but also relative to the money supply. On the chart below, the S&P 500-to-M2 money supply ratio recently formed a double top from the insane tech bubble levels. It is also still well above the peak of the housing bubble. For investors looking for bargains, it is not in the stock market at large. The precious metals are almost solely the place to be today.
*
*
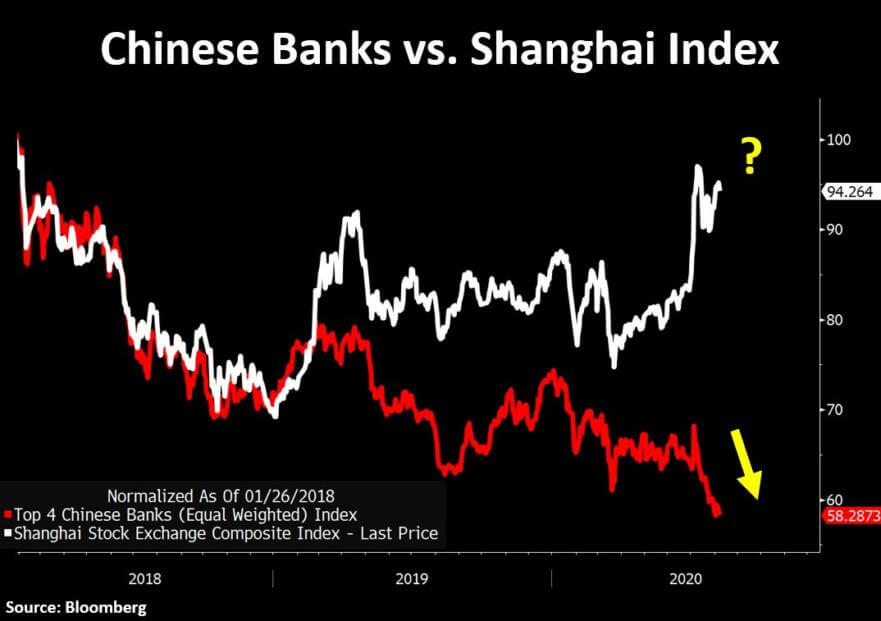
How does it all end? Colossal monetary dilution. None of us owns enough gold. It is not just the US dollar that will be challenged. It is all the global fiat currencies of highly indebted countries. The Chinese Yuan for instance is in an even worse predicament than the US dollar.
*
Chinese and Hong Kong banks are the most leveraged financial institutions in the global markets today. Chinese banks hold close to $43 trillion worth of highly inflated assets compared to China’s $14 trillion nominal GDP, an imbalance significantly greater than US and European banking imbalances that precipitated the Global Financial Crisis in 2008. Chronically troubled, the top four Chinese banks have been under pressure for years now and have significantly been diverging to the downside relative to the Chinese stock market at large, similar to US banks in 2007. China, formerly the growth engine of the global economy responsible for 60% of global GDP from 2009 to 2019, has finally reached credit exhaustion.
*
*
All fiat currencies are in a race to the bottom versus gold today. The macro-environment is one of a global synchronized monetary debasement.
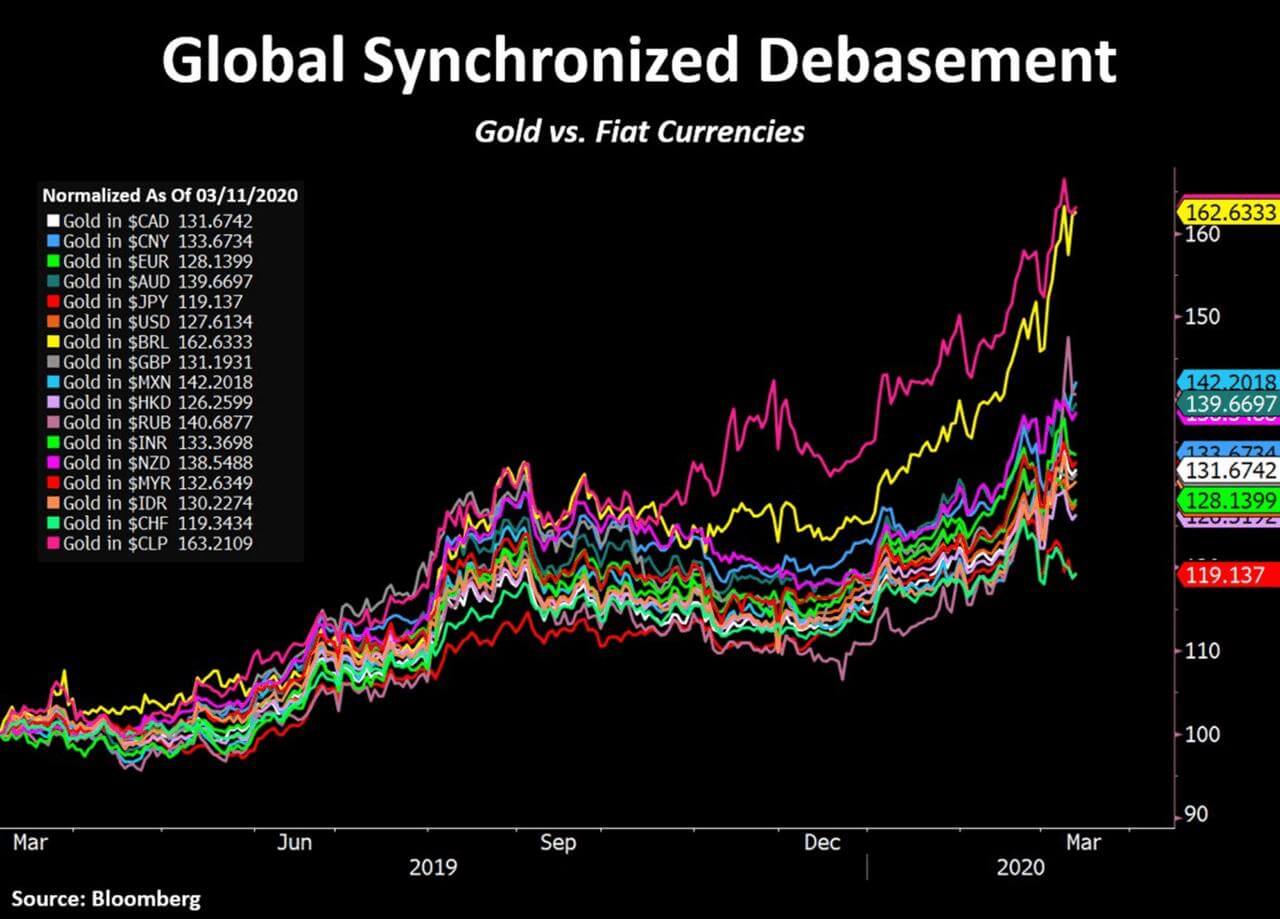
*
We will trace the currency debasement back in history in another article. For now, the bottom line of the story is that nowadays it is good to have real money in your portfolio more than ever.
LEGAL DISCLAIMER:
While the author has made every effort to provide accurate data and information in the preparation of this article, neither europabullion.com nor the author assumes any responsibility for errors or for changes that occur after the publication. The information referenced is believed to be reliable, accurate, and appropriate, but is not guaranteed in any way. The strategies and forecasts herein are the author’s sole opinion and could prove to be inaccurate. No company, individual, or entity compensated the author or europabullion.com for mention in this article.
The article contains specific names of companies, strategies, different currencies, shares, government bonds, types, and sizes of precious metals, none of which can be deemed recommendations to the readers. Reading this article does not constitute a fiduciary relationship. Data, company-specific or otherwise, will not be updated on an ongoing basis. After the publication of the resources, the author and europabullion.com will not be responsible for future developments.
A registered financial advisor is always the best source of guidance in making financial decisions. The author is not a registered financial advisor and does not address the individual financial condition of the reader.