
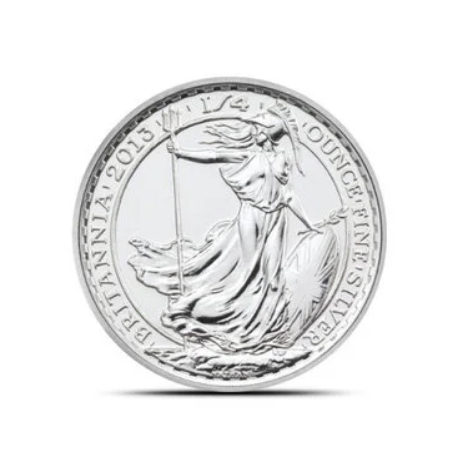
A one-quarter-ounce silver bullion coin made by the U.K.'s Royal Mint in 2013.
*
We can agree that silver is useful. It was one of the first five metals used by humans (the others being gold, copper, lead, and iron), and readers in North America will be familiar with silver’s monetary and industrial applications. The latter are shaped by silver being the most reflective metal, and it having the highest electrical conductivity of any element and the greatest thermal conductivity of any metal.
Across the pond, we Europeans have treasured silver for millennia, boosted perhaps by the protection it offers against vampires, witches and (in particular) werewolves. Being handy against the undead, 18th century Central Europeans hammered silver nails into coffins, just in case.
Europeans and silver go even further back. The metal was first mined in Anatolia (modern-day Turkey) in 3000 B.C.E., and the centre of silver mining globally had moved to Spain by 1000 C.E.
There is evidence of silver mining in Britain before the Norman invasion of 1066, and extraction became extensive here over the next 400 years. Indeed, the British currency, sterling, is derived from a Norman silver coin minted in the 11th century. ‘Ster’ is an English word from the Middle Ages meaning strong, which described a coin that remained a consistent weight of 22.5 grains over a 200-year period.
European love of the shiny metal escalated after our New World landings in 1492. The Spanish, in particular, mined the metal enthusiastically, with an estimated 85% of the silver produced worldwide between 1500 and 1800 coming from Bolivia, Peru, and Mexico.
There was still silver being mined in Europe, and the Thaler silver coin was in circulation in Europe from the 15th to 19th centuries using metal mined in Bohemia. The name was derived from the German for the valley and is believed to have evolved into the name for numerous currencies, including the dollar.
Silver (like iron) doesn’t work against ghosts, but the grey metal (silver’s symbol comes from the Latin for grey, Argentum) surely doesn’t deserve its historic low rating against gold. This disparity has widened in recent years, with the yellow metal trading at a multiple of over 70 times the silver price.
*
*
As noted by New York-based CPM Group earlier this year, silver normally outperforms gold during a gold bull market. CPM attributes this to silver’s significantly smaller, and less liquid, market. Also, because silver has numerous industrial uses, economic distress hurts silver fabrication demand more than for gold.
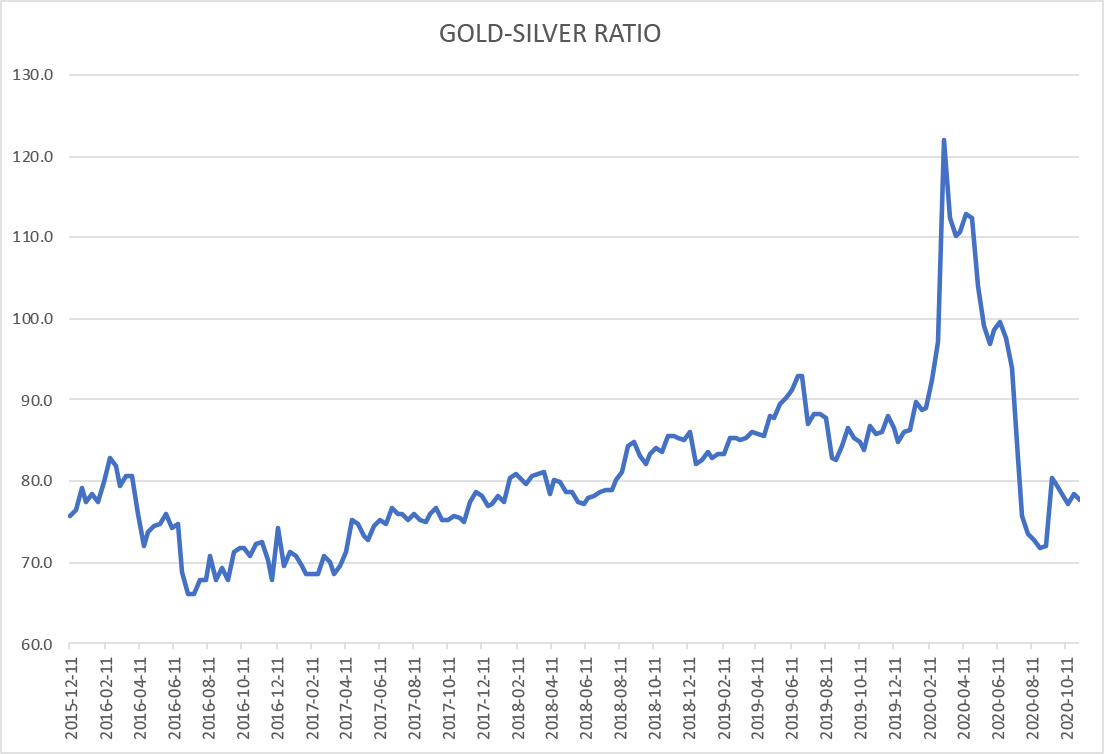
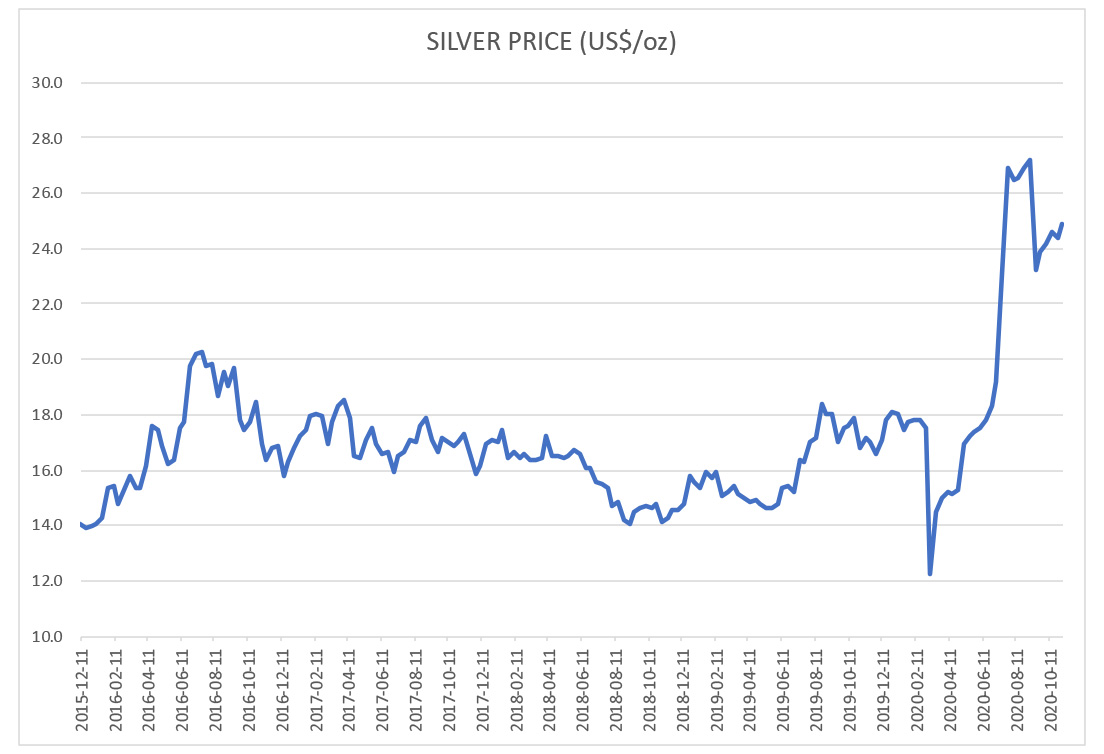
The silver price bounced along in a range between US$14 and US$18 per oz. from October 2016 until February this year. Gold had an almost linear rising price ratio against silver during this period, and the gold-silver (Au-Ag) multiple jumped to 126 in March 2020, when the silver price slumped to US$12 per ounce.
The price of silver has recovered strongly since April, reaching over US$28 per oz. at the beginning of September, with both precious metals benefitting from dollar weakness.
Silver prices have plateaued over the past two months, with industrial demand for the metal recovering more slowly than production. Despite the silver-price correction, gold underperformed its precious-metal cousin in September and October, and the Au-Ag multiple is back to around 78 (which is still well above the 66 recorded in July 2016).
Despite the valuation disparity between the two precious metals, silver is only 19 times more abundant than gold in the crust (75 parts per billion, compared with 4 parts per billion), and barely nine times as much has been mined (an estimated historic total of 1.7 million tonnes against 200,000 tonnes of gold). Most of this mined precious metal is still with us, and above-ground stocks amount to over 180,000 tonnes of gold and perhaps 1.6 million tonnes of silver (the latter figure according to Voima Gold Oy, a Helsinki-based investment company).
*
*
We are adding to this available metal at an annual rate of around 3,300 tonnes (106 million oz.) of gold and 27,100 tonnes (870 million oz.) of silver, barely eight times the gold output. The valuation of last year’s gold production was US$149 billion (at an average price of US$1,404 per oz. in 2019), with only US$14 billion of silver (at US$16.30 per ounce).
Both precious metals are doing well against a backdrop of loose monetary policy, geopolitical and pandemic risks, and the low-interest-rate environment. Investor sentiment towards gold and silver is positive, and the mid-term outlook for both seem bullish. Nevertheless, the grey metal surely deserves a higher comparative price; gold might be hoarded but silver is used.
*
By Chris Hinde- Special to the Northern Miner
Dr. Chris Hinde is a mining engineer and the director of Pick and Pen Ltd., a U.K.-based consulting firm he set up in 2018 specializing in mining industry trends. He previously worked for S&P Global Market Intelligence’s metals and mining division.
This article is published with the special permission of CPM Group. For more views and news you can visit https://www.cpmgroup.com/
*
LEGAL DISCLAIMER:
While the author has made every effort to provide accurate data and information in the preparation of this article, neither europabullion.com nor the author assumes any responsibility for errors or for changes that occur after the publication. The information referenced is believed to be reliable, accurate, and appropriate, but is not guaranteed in any way. The strategies and forecasts herein are the author’s sole opinion and could prove to be inaccurate. No company, individual, or entity compensated the author or europabullion.com for mention in this article.
The article contains specific names of companies, strategies, different currencies, shares, government bonds, types, and sizes of precious metals, none of which can be deemed recommendations to the readers. Reading this article does not constitute a fiduciary relationship. Data, company-specific or otherwise, will not be updated on an ongoing basis. After the publication of the resources, the author and europabullion.com will not be responsible for future developments.
A registered financial advisor is always the best source of guidance in making financial decisions. The author is not a registered financial advisor and does not address the individual financial condition of the reader.