
Silver prices have fallen 65% since their peak in 2011. Accommodative monetary policies and negative bond yields have placed "poor man's gold" on a favorable trend this year.
The attention of the strategists is gradually focused on gold and silver. The reasons are many. "The first is that of portfolio diversification at a time when $ 15 trillion in bonds offer a negative return," said Olivier Rigot, managing partner at EMC Wealth Management in Geneva. Since all the gold mined is only $ 6 trillion, it only takes a slight increase in demand for prices for yellow metal to run high.
Trend historically front runs multi-year price rallie$ per oz
 |
“Precious metals cycles are special. The rise is initially slow, it accelerates and ends up being exponential, before a fall and a long hibernation”, continues the manager. "The interest of customers is again more marked now," he says. Olivier Rigot also appreciates the protective nature of gold against demonetization of the currency following the accommodating policies of the central banks.
A promising technical indicator
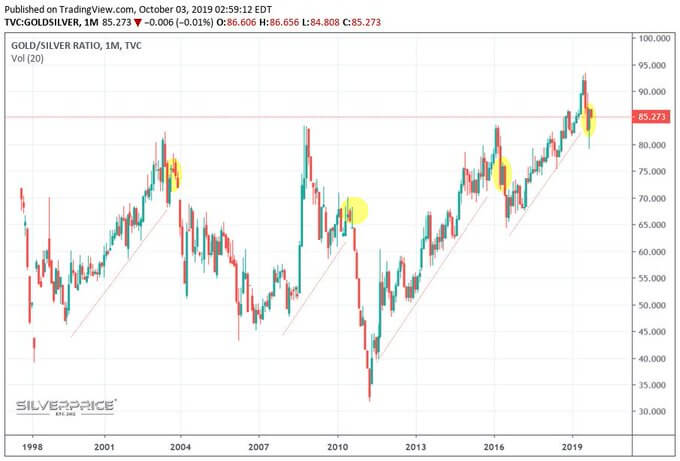
Silver may have better cards in hand than gold. The ratio between the ounce of gold and that of silver is a technical signal particularly observed by certain analysts of precious metals. However, it indicates a major change in trend. After years of rising, it peaked at 91 last July, meaning it took 91 ounces of silver for an ounce of gold. Since then, it has dropped slightly to 85. However when this ratio drops, it generally results in a positive development of precious metals in the medium term, says Sean Brodrick, the author of the specialized letter Wealth Wave.
The main interest of this report consists in specifying the best means of investment in precious metals, according to the specialist in precious metals trading GSI Exchange. Since the movements of silver are usually stronger than those of gold, upwards or downwards, the bullish investor in precious metals will therefore prefer the first. It is also true that this volatility frightens certain institutional investors and reduces the attractiveness of “poor man's gold” with pension funds, notes Giovanni Staunovo, precious metals analyst at UBS.
From Rome to the present day
The relationship between gold and silver has continued to evolve in history and to depart from that which prevails in nature. On the earth's crust, it is 17.5 to 1, according to Brodrick. In Roman times, the Emperor Augustus had established a monetary system based on trimetallism. The aureus then weighs 8 grams of gold and its relationship with the silver denier is twenty-fifth. The choices and reforms will continue to change thereafter, depending on production difficulties and geopolitics. For example, in 1661, due to a shortage of silver-metal, the banker Johann Palmstruch introduced the first bank note in Europe.
Gold/Silver ratio at critical inflection point Ratio might hit 75 within a month...
 |
In the twentieth century, the ratio is on average from 47 to 1 and in the last twenty years from 60 to 1, according to Brodrick. But in the financial markets, the value of each metal is a function of other factors, sometimes emotional, so that the ratio between gold and silver varies greatly.
Significant increase in 2019
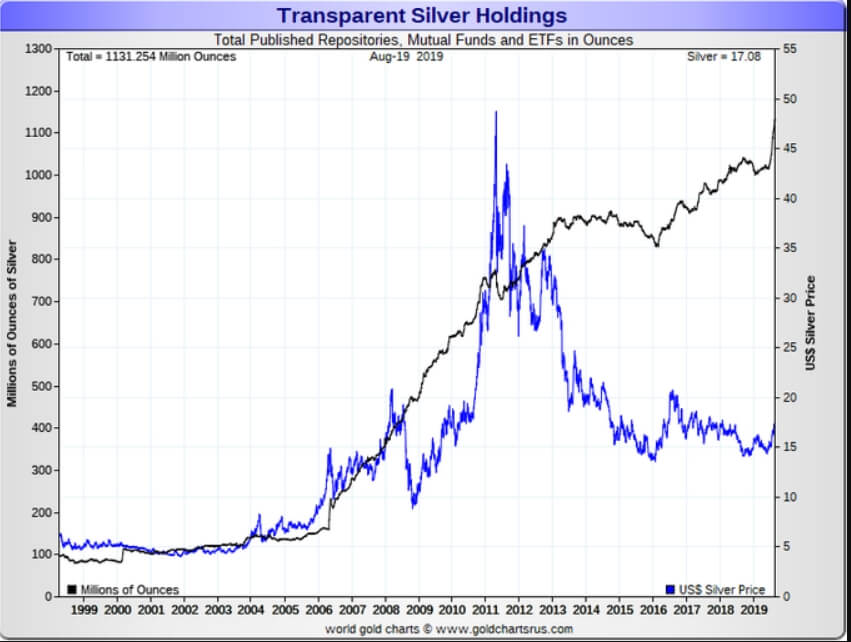
Currently, the trend is upward for gold, with a gain of 26% in dollars over a year and 17% since the beginning of the year. It is also, but to a lesser extent, for the ounce of silver, with an increase of 13% for fifty-two weeks and since the beginning of January. Silver earnings are lower because of the strength of the dollar, experts say. But we must put this variation into perspective compared to the 2011 high. Silver has fallen 65% since its peak of nine years ago, while gold is only traded 18% below the highest.
The silver ounce, currently at $17.70, is expected to climb to $ 20 in the first half of 2020 and even to $ 20.50 in the second half of 2020, predicts UBS. The big bank bases its arguments on the prospect of a further fall in real interest rates in the United States, on the reversal of the trend of the dollar, which should depreciate, and on the economic slowdown.
However, demand from industry corresponds to 60% of the total demand for silver, against only 10% for gold. Silver requirements come from electrical components (over 20%), jewelry (20%), coins and bars (18%) and increasingly from the photovoltaic industry (8%), says Giovanni Staunovo. Money is also seen as protection against falling stocks.
ETF support
ETFs support recovery of precious metals. They bought 105 million ounces of silver this year, up 20%, for a total value of $ 11 billion. These listed index funds also accumulated 81 million ounces of gold, up 15%, according to the Bloomberg agency. Falling US interest rates should support precious metals, according to UBS. They should also benefit from the uncertainties linked to the trade conflict between China and the United States and the economic slowdown, note the strategists.
Institutional demand is growing. The Bank of China has added 100 tonnes of gold to its reserves since last December. Beijing needs to diversify its assets outside the dollar, according to strategists. Globally, central banks accumulated 374 tonnes of gold in the first half of this year alone, so demand has been highest for three years, according to the World Gold Council. "Investors who seek to diversify their assets by purchasing precious metals therefore follow the same behavior as central banks," says Olivier Rigot.
Decrease in production
The money supply is hardly worth it. There is a drop in production from the three main producers, Peru (-10%), Chile (-7.2%) and Mexico (-4%). If the trend continues, production could reach 840 million ounces this year, up from 855 million last year.
The most optimistic recall that the ratio between gold and silver amounted to 14 on January 2, 1980. On this basis, the potential seems major. According to the precious metals trading consultant GSI Exchange, the ratio between gold and silver has remained at 16 for thousands of years, why should it be as high as today?