
Most probably Silver will outperform the Gold in the upcoming Bull Market.
*
This morning, on the 9th of September, 2020, spot gold opened at $1,928.10 an ounce in Europe while spot silver opened at $26.60 an ounce. In essence, the market thinks that gold is approximately 72.5 times more valuable than silver. The truth of the matter is that gold has always been valuable than silver but gold at least historically should not exceed 72.5 times the value of silver.
Precious metals are precious because they are rare; for instance, sand is available everywhere and it is cheap, precious metals such as gold, silver, platinum, palladium, etc. are rarer to find and it takes tremendous energy to mine them – hence the “precious” connotation. Mining experts affirm that the Earth’s crust has about 17 times more silver than gold; hence, gold should be naturally more expensive than silver.
However, silver is being used up at a faster rate than gold – silver is mined at a ratio of 11 to 1 against gold. Historically, gold has always been approximately 35 times more expensive than silver; however, the current trade price of gold in relation to silver is disproportionate. The gold-silver ratio indicates how many ounces of silver are required to buy one ounce of gold. In time periods where the ratio is relatively high, it acts as a leading indicator for a rise in silver’s value. As technical indicators go, the ratio of the gold price to silver prices, commonly referred to as the gold-silver ratio, is considered by precious metal traders to be one of the most reliable indicators for forwarding price movements in silver. Previously the highest the ratio has ever been was 132 to 1 in 1933 when the US government invoked Executive Order 6102 and forced US citizens to sell all but a small portion of their gold and silver holdings to the Federal Reserve.
In more recent years the highest the ratio has reached is 97.3 to 1 in February 1991 (Figure 1), at the height of a global economic recession. After this high in the ratio, the silver price rose in a continued uptrend from an average price of US$3.74/oz in February 1991 to US$6.84/oz in February 1998, an increase of 83%.
*
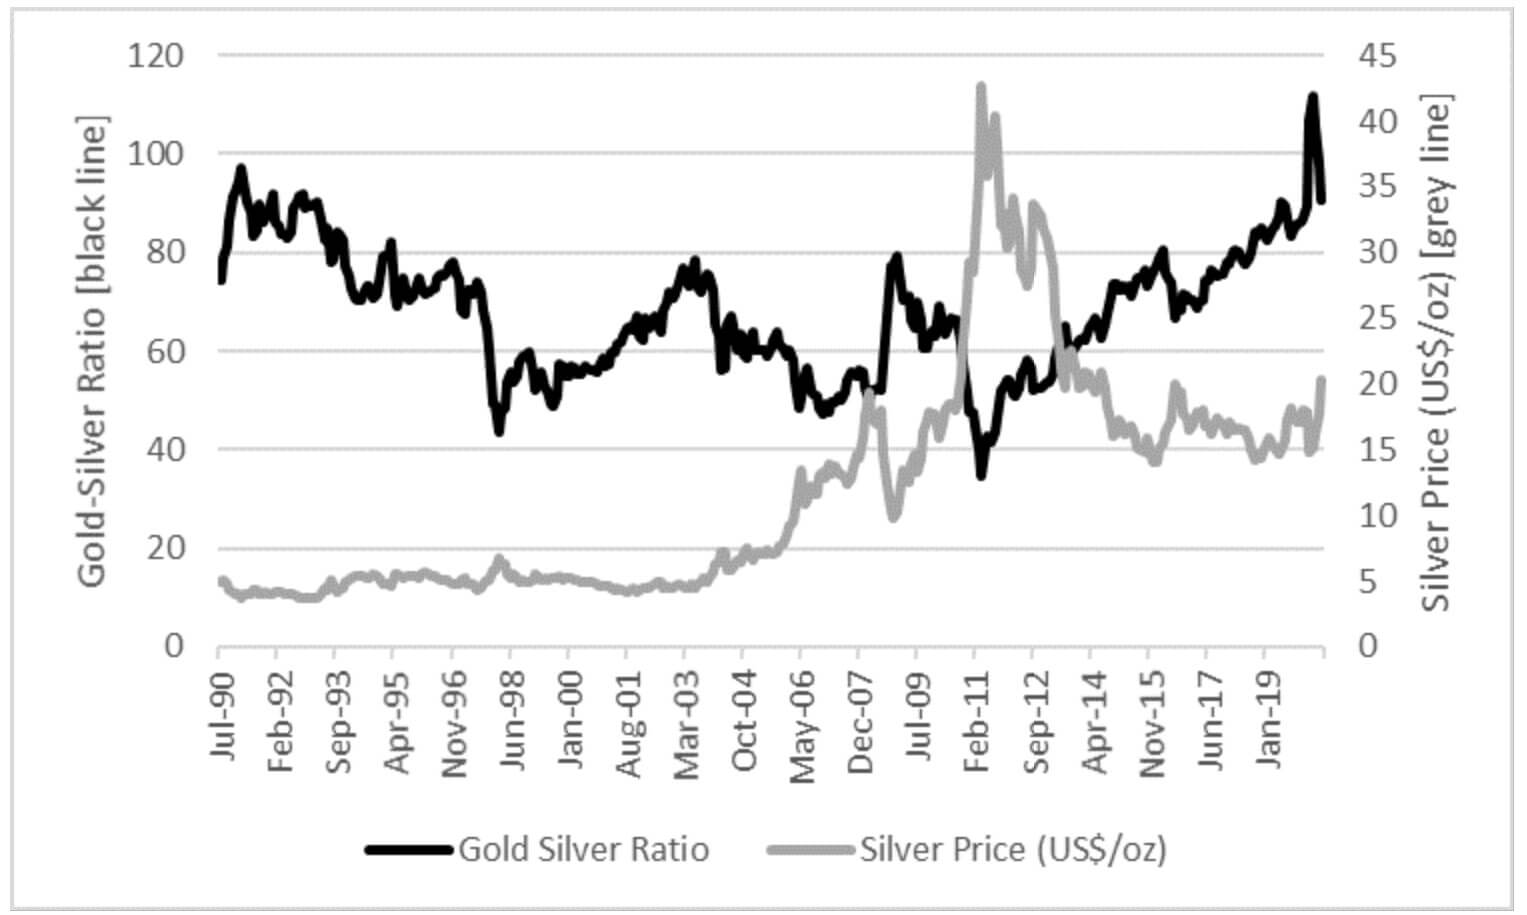
Figure 1: Gold-Silver Ratio since 1990
*
In June 2003, after a sustained five-year period of lower gold-silver ratios, the gold-silver ratio reached a high of 78.7:1, over the next five years the silver price rose from US$4.53/oz to a high of US$19.32/oz in March 2008, (Figure 1) an increase of 326%.
A spike in the gold-silver ratio in December 2008 to 79.3:1, associated with another global recession, was a leading indicator of a 315% increase in the silver price from US$10.29/oz in December 2008 to US$42.7 in April 2011 (Figure 1).
The gold-silver ratio has now risen from a low of 34.7:1 in April 2011, its lowest level since 1979, to its highest level in 87 years of 111.7:1 in April 2020, before reducing to 72.5:1 in August on the back of 113% rise in the silver price over just five months (Figure 1).
If the global economic uncertainties continue, we can reasonably expect that the price of gold will increase in the short to medium terms. However, we can expect the price of silver to rise at an exponentially higher rate in order to catch up with gold and restore the historical price difference. The current $26.60 an ounce-trading price of silver also provides investors with a lower entry barrier.
The second reason that makes silver a better investment than gold is that silver has more industrial applications than gold — the industrial applications of silver ads to its demand, for example, the building of the 5G network requires a lot of silver for years to come. Silver is reflective, thermally conducive, and electronically conductive. In the last 30 years, more patents that require the use of silver have been granted than gold-based patents. It was reported that about 1 billion ounces of silver were used in consumer products in the last 10 years.
The industrial applications of silver will also increase in the coming years because only trace amounts of silver are used in industrial applications. Hence, it is not practical to recycle the silver that has been used in commercial applications – it makes more sense to mine and use the new silver than to recycle silver from older products. It is logical to expect that the rate at which industrial applications use up silver will continue to rise in the coming years. However, silver is a naturally occurring metal and there is a finite supply of silver in the earth’s crust. For that matter, it is logical to expect the price of silver to trend up in the coming years. The biggest part of the silver price has been formed on the markets but the industrial use of the metal also affects that.
The third reason that suggests that silver investors will be better off than gold investors in the long term is the level of uncertainties that surround the supply of silver. Uncertainties about the supply of precious metal could affect its trading price and the price tends to rise when the uncertainties suggest that the supply will fall.
Silver is mined in some of the most volatile regions on earth; there’s always a probability that its supply will drop. For instance, Silver is mostly mined in countries where political unrest, labor conflicts, poor infrastructure, and economic manipulations are a common occurrence. Much of the silver in the world is mined in Mexico, Peru, Chile, Bolivia, and China. China appears to be relatively stable but the country utilizes more and more of its own silver for inner operations.
Eventually, the silver-gold historic ratio of 1:35 will be met or bypassed again in the near future. All the charts show a great future for both gold and silver but silver most definitely will outperform gold.
*
LEGAL DISCLAIMER:
While the author has made every effort to provide accurate data and information in the preparation of this article, neither europabullion.com nor the author assumes any responsibility for errors or for changes that occur after the publication. The information referenced is believed to be reliable, accurate and appropriate, but is not guaranteed in any way. The strategies and forecasts herein are the author’s sole opinion and could prove to be inaccurate. No company, individual, or entity compensated the author or europabullion.com for mention in this article.
The article contains specific names of companies, strategies, different currencies, shares, government bonds, types and sizes of precious metals, none of which can be deemed recommendations to the readers. Reading this article does not constitute a fiduciary relationship. Data, company specific or otherwise, will not be updated on an ongoing basis. After the publication in the resources, the author and europabullion.com will not be responsible for future developments.
A registered financial advisor is always the best source of guidance in making financial decisions. The author is not a registered financial advisor and does not address the individual financial condition of the reader.